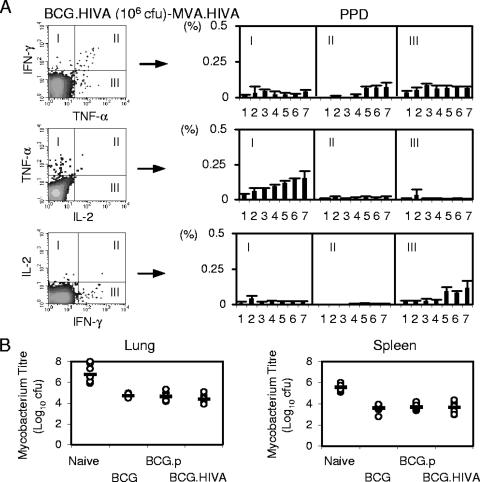
FIG. 6.
Immune responses and protection against M. tuberculosis challenge by BCG.HIVA. (A) The mice and the treatment groups were the same as those described in the legend to Fig. 3A (immunized mice were primed with increasing doses of BCG.HIVA). Left panels show examples of bifunctional analyses using PPD as an antigenic stimulus. On the right, data corresponding to dot blot quadrants I, II, and III for each immunization group are shown as means ± SD (n, 4 to 5 mice). (B) Mice were left naïve or immunized subcutaneously in their left hind legs with the presently used BCG vaccine, a parental BCG, or lysine auxotrophic BCG.HIVA and challenged with inhaled M. tuberculosis. M. tuberculosis loads in lungs (left) and spleens (right) were determined 4 weeks later. Data for individual mice (circles) and geometric means for each group (n, 7 to 9 mice) are shown.

