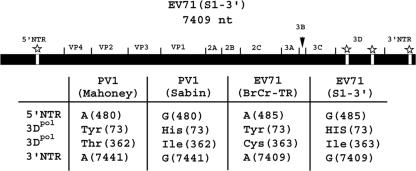
FIG. 1.
Schematic diagram of the EV71(S1-3′) genome. The sequences derived from the parental EV71(BrCr-TR) genome are represented by the black regions, and the mutations derived from PV1(Sabin) are represented by the white regions with stars above them. Corresponding mutations of PV1(Mahoney), PV1(Sabin), and EV71(BrCr-TR) are also shown. The numbers in parentheses are the nucleotide positions in the genome or the amino acid positions in the 3Dpol protein. The figure was adapted from a previously published figure with the permission of the Society for General Microbiology (5).

