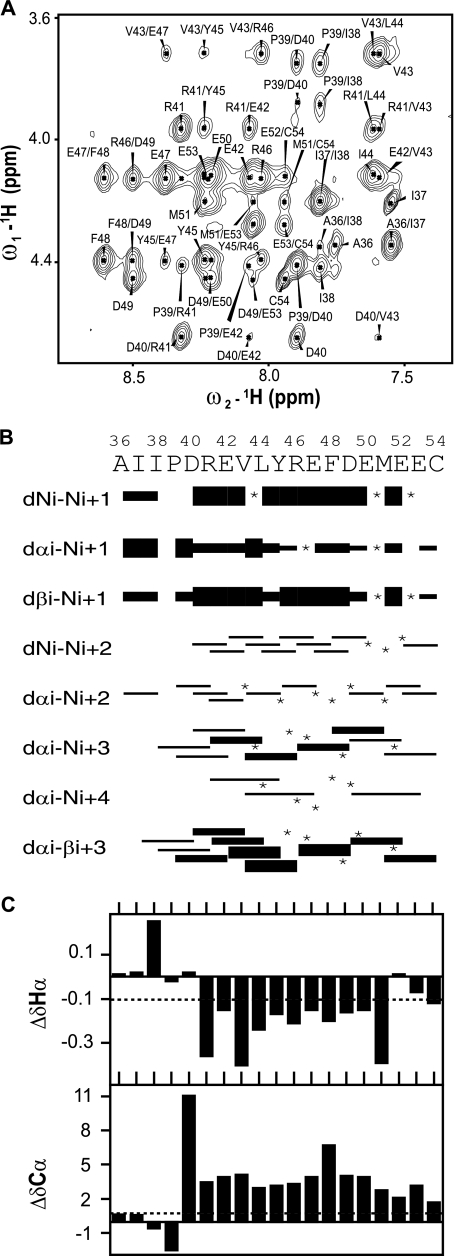
FIG. 7.
NMR analysis of NS4A[36-54]. (A) Extract of the amide-aliphatic region of the NOESY spectrum recorded with the peptide at pH 3.8 in 50% TFE. (B) Summary of sequential (i,i+1) and medium-range (i,i+2 to i+4) NOEs. Intensities of NOEs are indicated by bar thickness; asterisks indicate that the presence of a NOE is not confirmed because of resonance overlap. (C) Chemical shift differences for 1Hα and 13Cα at each position.

