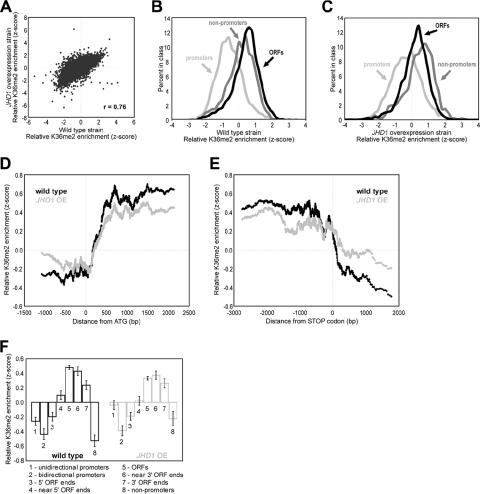
FIG. 5.
JHD1 overexpression promotes a subtle 3′ shift of H3K36me2. (A) Scatter plot of H3K36me2 ChIP enrichment in wild-type yeast versus the JHD1 overexpression strain. (B) Lined histograms of the z-score distribution for SGD-annotated ORFs, promoters, and nonpromoters in the wild-type yeast strain BY4741. (C) Same analysis as for panel B, except this is for the JHD1 overexpression strain. Note the enrichment of nonpromoters. (D) Tiling probes spaced at ∼200 bp along chromosome III (see Materials and Methods) were sorted according to their distance to the closest start codon. A moving average of the data from H3K36me2 ChIPs was then calculated using a window of 100 and step size of 1. Any probe lying within an ORF but calculated to be upstream of its closest start codon or any probe lying within an intergenic region but downstream of a start codon was removed from this analysis. (E) Same analysis as in panel D, except the data were aligned to the translation stop codon of each gene. Any probe lying within an ORF but downstream of its calculated closest stop codon or any probe lying within an intergenic region but upstream of a stop codon was removed from this analysis. (F) Higher-resolution probes that tile chromosome III were assigned to annotations as labeled on the x axis. Annotations were based on the May 2006 version of the SGD. ORF 5′ or 3′ ends indicate probes that contain the start or stop codons, respectively. ORFs near the 5′ or 3′ ends represent the probes adjacent to those containing start or stop codons, respectively. The enrichment level indicates the average for all probes of that type, and the error bars indicate standard errors of the means.

