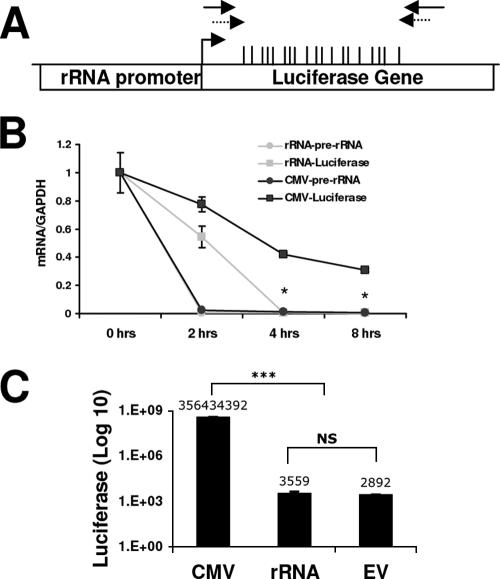
FIG. 7.
rRNA-pGL3 transcription is driven by Pol I. (A) Physical map of the rRNA-pGL3 plasmid containing the rRNA promoter and the luciferase gene. The positions of the CGs within the area examined are indicated by the vertical bars. The primers used for ChIP assay and bisulfite mapping are indicated with solid and dashed arrows, respectively. (B) HEK 293 cells were transfected with CMV-pGL3 or rRNA-pGL3 for 32 h. Prior to harvesting, the cells were treated with 5 μg/ml actinomycin D for 0, 2, 4, or 8 h. RNA was extracted and treated with DNase. Results shown are from quantitative RT-PCR amplification of luciferase (squares) and pre-rRNA (circles) sequences normalized to GAPDH mRNA levels. Student's t test was used to analyze rRNA-pGL3 versus CMV-pGL3 luciferase mRNA amplification (*, P < 0.05). (C) HEK 293 cells were transfected with CMV-pGL3, rRNA-pGL3, or pGL3 (promoterless, empty vector [EV]) for 48 h. Values represent luciferase activities relative to total protein levels and are representative of three independent experiments (mean ± standard error of the mean). Student's t test was used for analysis of CMV-pGL3 versus rRNA-pGL3 or pGL3 (***, P < 0.001). NS, nonsignificant change between the rRNA-pGL3 and pGL3 luciferase values.

