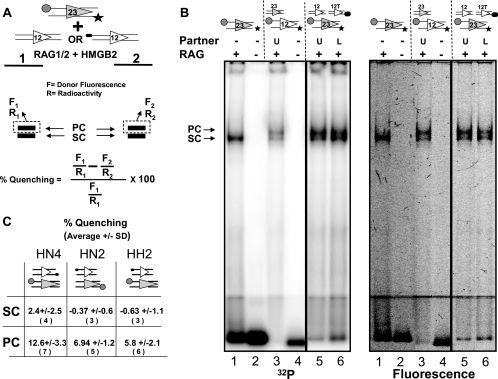
FIG. 6.
Detection of energy transfer in the PC by using an in-gel FRET assay. (A) Schematic diagram of the in-gel FRET assay. A 23-RSS labeled with the donor (circle) and 32P (star) was incubated with the RAG and HMGB2 proteins and either an unlabeled 12-RSS (lane 1) or a 12-RSS labeled with the acceptor (oval; lane 2). After gel electrophoresis, donor fluorescence (F) and radioactivity (R) were determined for each band and the percentage of quenching was determined as indicated by the formula. See the text for additional details. (B) EMSA using a discontinuous 4%/7.5% polyacrylamide gel. RSSs are indicated above the lanes by the symbols used in panel A; 12T indicates the 12-RSS labeled with TAMRA at its 5′ nonamer end. RAG proteins and partner RSSs were added as indicated above the lanes. U, unlabeled partner; L, TAMRA-labeled partner, +, present; −, absent. The same gel was scanned for radioactivity (left image) or fluorescence (right image) as described in Materials and Methods. Quantitation of lanes 5 and 6 allowed the percentages of quenching to be calculated for the PC (9.23%) and the SC (0.50%). Lane 1 shows that only the SC is formed in the absence of a partner. Lane 3 shows that a doubly labeled 12-RSS generates shifted complexes of the same mobility as the doubly labeled 23-RSS. (C) Results obtained from in-gel FRET experiments with the three configurations of fluorophores depicted, expressed as percentages of quenching of FAM fluorescence ± standard deviations (SD). The number of independent measurements made is indicated in parentheses below each value. Note that in some experiments, only one of the two shifted complexes was visualized and quantitated.

