
Figure 5.
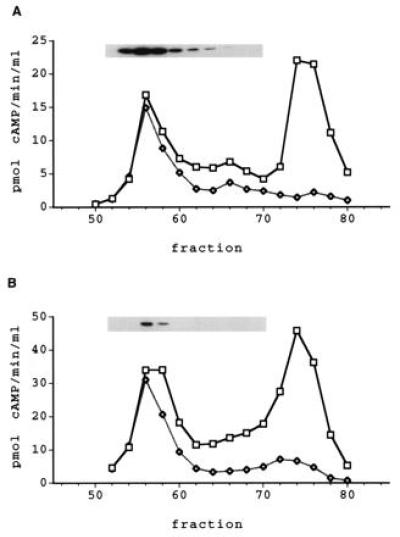
PDE7 Activity in Hut78 and H33HJ-JA1 T-cells. Soluble extract (20 mg) was fractionated using Mono-Q HPLC, as described in the text. (A) The elution profile for Hut78 cells and (B) the profile for H33HJ-JA1 cells. Squares represent total PDE activity, and diamonds indicate PDE activity insensitive to 10 μM RO 20–1724. Samples corresponding to the peaks of PDE activity were Western blotted using antiserum 6858. The insets show the immunoreactive bands from the blots overlying their respective fractions.