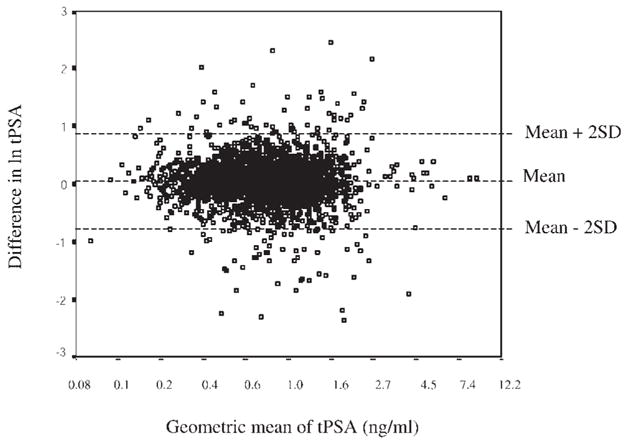
Fig. 1.

Bland Altman plot showing the correlation of the means and differences of logarithmically transformed tPSA values measured at screening of the whole study population in 1995–1996 and 1997–1998. Values on the x-axis have been transformed anti-logarithmically.
