
Figure 8. Peak and late INa were unaffected by 1 μM BayK8644.
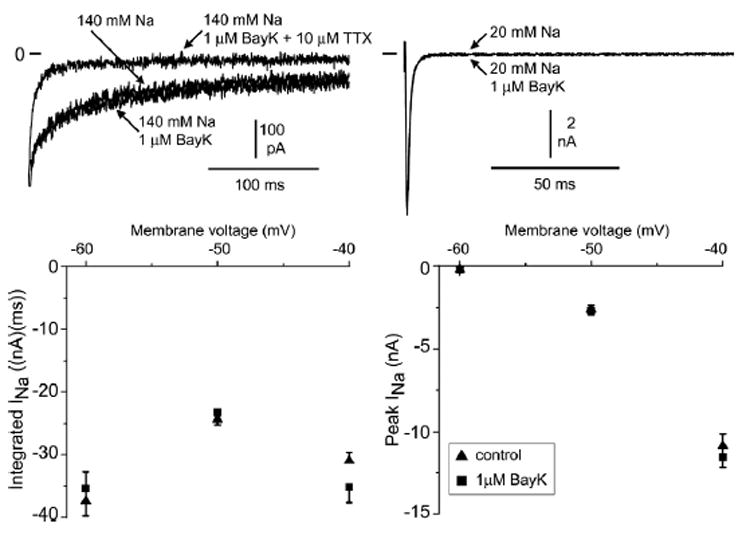
Representative traces of currents recorded at −40 mV after a depolarizing pulse step from a holding potential of −120 mV. Top left: Late INa recorded in 140 mM external sodium, after addition of 1 μM BayK8644, and in the presence of 1 μM BayK8644 and 10 μM tetrodotoxin. Top right: Peak INa recorded in 20 mM external sodium and after addition of 1 μM Bay K. Summary current–voltage plot for integrated current in 140 mM external sodium (bottom left; 7–10 cells) and peak INa in 20 mM external sodium (bottom right; 11 cells). Values are given as average ± SEM.