
Fig. 4.
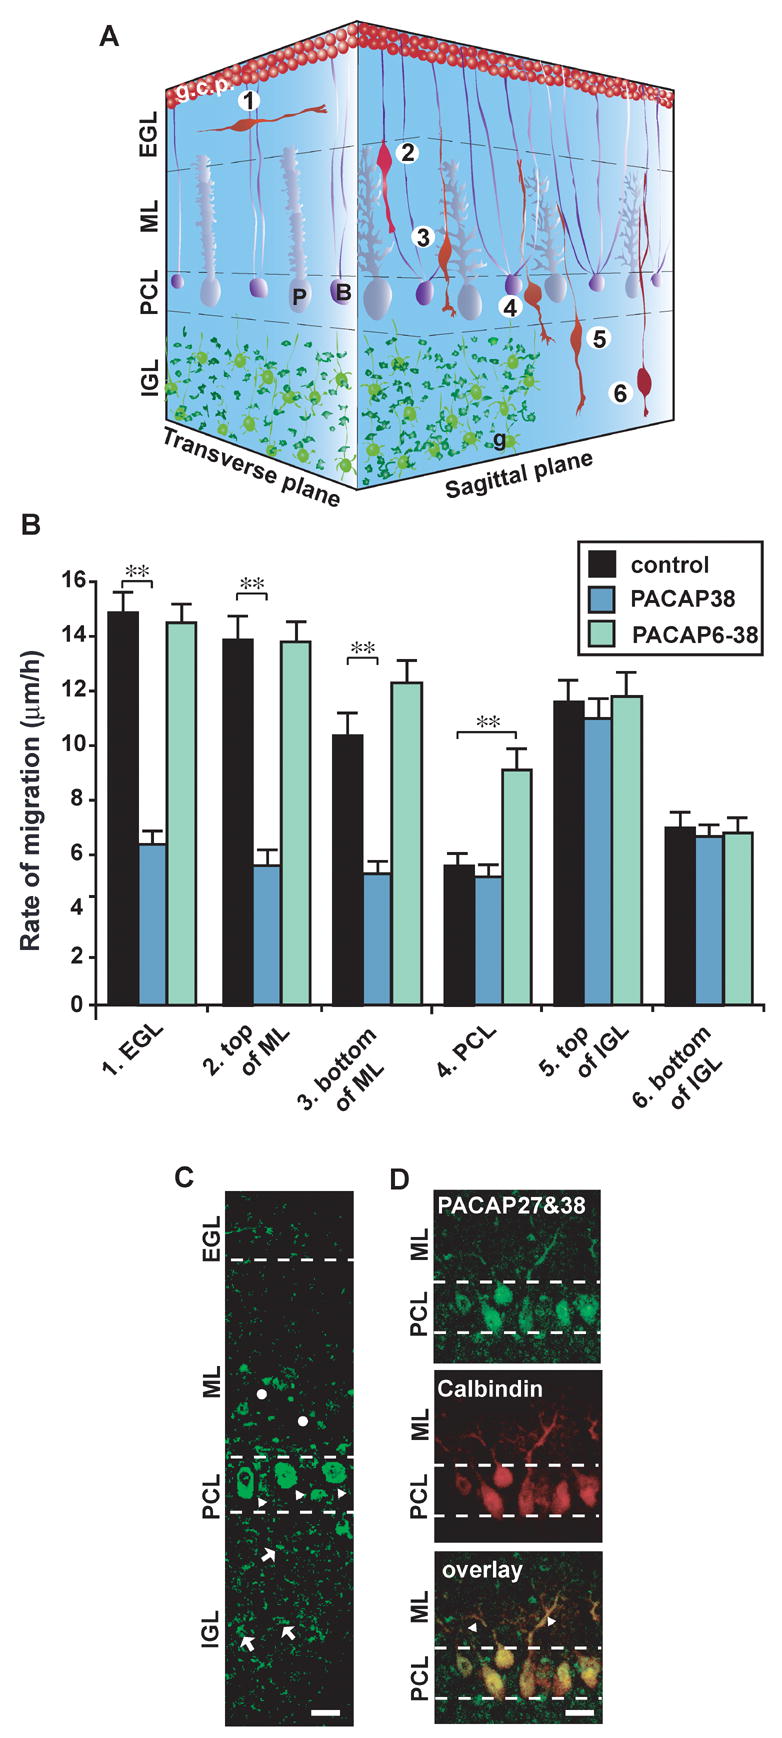
Cortical layer-specific effects of PACAP38 and its antagonist, PACAP6–38, on granule cell migration in the P10 mouse cerebella. (A) Three-dimensional representation of granule cell migration from the EGL to the IGL in the early postnatal mouse cerebellum. 1, Tangential migration in the EGL; 2, Bergmann glia-associated radial migration at the top of the ML; 3, Bergmann glia-associated radial migration at the bottom of the ML; 4, stationary state or slowdown of migration in the PCL; 5, glia-independent radial migration at the top of the IGL; 6, glia-independent radial migration at the bottom of the IGL. Abbreviations: B, Bergmann glial cells; g.c.p., granule cell precursors; P, Purkinje cells; g, postmigratory granule cells. (B)Differential effects of 1 μM of PACAP38 or PACAP6-38 on granule cell migration in the different cortical layers (the EGL, ML, PCL and IGL) of P10 mouse cerebella. Each column represents the average values obtained from at least 30 migrating cells. Bar: S.D. (C) Expression of endogenous PACAP (27 and 38) in the P10 mouse cerebellum. Circles represent a sporadic staining in the bottom of the ML. Triangles represent an intensive staining in the Purkinje cell somata in the PCL. Arrows represent numerous small stainings, possibly mossy fiber terminals, in the IGL. Scale bar: 11 μm. (D) Co-localization of the endogenous PACAP (27 and 38) and calbindin in the dendrite and somata of the Purkinje cells. Triangles represent the double-staining dendrites of the Purkinje cells in the bottom of the ML. Scale bar: 11 μm.