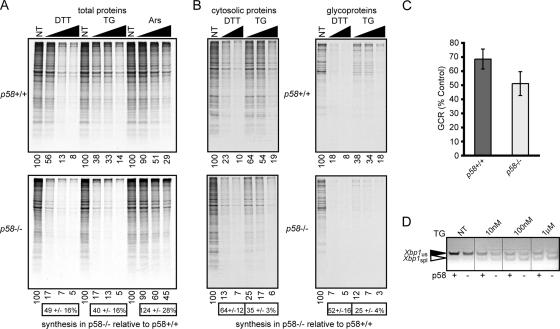
Figure 1.
p58−/− cells exhibit a lower ER substrate burden than wild-type cells. (A) Wild-type (top) and p58−/− (bottom) MEFs were treated with varying concentrations of DTT (0.1, 0.3, and 1 mM), TG (0.1, 1, and 10 μM), or arsenite (Ars; 10, 30, and 100 μM) for 30 min and labeled for 15 min with [35S]methionine before analysis of total cell lysates by SDS-PAGE and autoradiography. Relative levels of [35S]incorporation (quantitated using a phosphorimager) are shown below individual lanes of each panel. The level of synthesis in p58−/− cells relative to wild-type cells for each stressor (mean ± SD; n = 3) is shown below the respective bottom panels. Note that for both DTT and TG (but not Ars), p58−/− cells show about half the level of overall protein synthesis relative to p58+/+ cells. In this and subsequent experiments, Coomassie blue staining before autoradiography confirmed equal total protein recovery and loading (data not shown). (B) After treatment with DTT (1 and 10 mM) or TG (0.1, 1, and 10 μM) and [35S]methionine labeling as described in A, cells were fractionated into cytosolic proteins (left) and glycoproteins (right) that were each analyzed by SDS-PAGE and quantified by phosphorimaging. The amount of 35S incorporation in each lane relative to the untreated condition in that panel is indicated below the autoradiographs. Note that for both p58−/− and p58+/+ cells, glycoproteins are consistently attenuated to a slightly greater degree during stress than cytosolic proteins. Quantitation of the average 35S incorporation into either cytosolic proteins or glycoproteins in p58−/− cells relative to wild-type cells was tabulated as described in A, and it is shown below the respective bottom panels. Note that although both cytosolic proteins and glycoproteins are made to lower relative amounts in p58−/− cells, the glycoproteins are affected to a greater extent. (C) The radiolabeled GCR was quantitated for all five ER stress conditions in B and normalized against the respective GCRs from nontreated cells for both genotypes. Plotted are the overall changes in GCR (mean ± SD) observed during ER stress in p58−/− and p58+/+ cells. (D) Wild-type and p58−/− MEFs were treated with the indicated concentrations of TG for 30 min, followed by RT-PCR to detect both spliced (spl) and unspliced (us) Xbp1 mRNA. Note the slight but consistently higher proportion of spliced Xbp1 seen in p58−/− cells at each stress condition. The image is presented in black-and-white inverted form for greater visual clarity.

