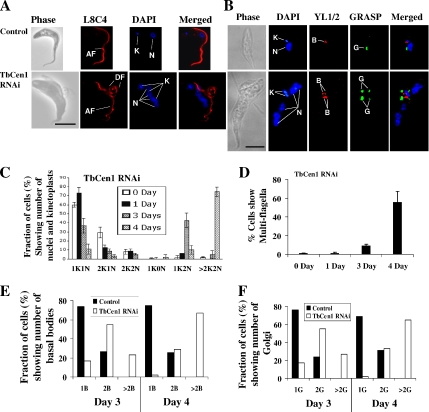
Figure 4.
(A and B) Microscopic images of control and TbCen1-depleted procyclic cells from day 4 cultures. In each cell, DAPI stained kinetoplasts (K) and nuclei (N), the L8C4 stained flagella (F), YL1/2 stained basal bodies (B), and GRASP stained Golgi (G). AF, attached flagellum; DF, detached flagellum. All the images are the same scale (scale bars, 5 μm). (C) Bar graph showing increase in the proportion of multinucleated and multikinetoplast cells with days after RNAi knockdown of TbCen1. Cells after different days of TbCen1 RNAi induction were stained with PI and examined by fluorescence microscope for tabulation of the cells with different number of kinetoplasts (K) and nuclei (N). (D) Percentage of TbCen1-depleted cells with multiflagella. Cells after different days of TbCen1 RNAi induction were observed under microscope under bright field, and the cells that contained more than two flagella were counted. For both B and C at least 250 total cells were observed for the quantitation at each time point. The data represent the means of ± SD of three independent experiments. (E and F) Percent of cells on day 3 and 4, which show varying number of basal bodies (E) and Golgi (F). The data only shows the number of mature basal bodies that were stained with YL1/2 Ab and were easily visible than the probasal bodies and GRASP that stains the Golgi as in B. In each case more than 125 cells were analyzed.

