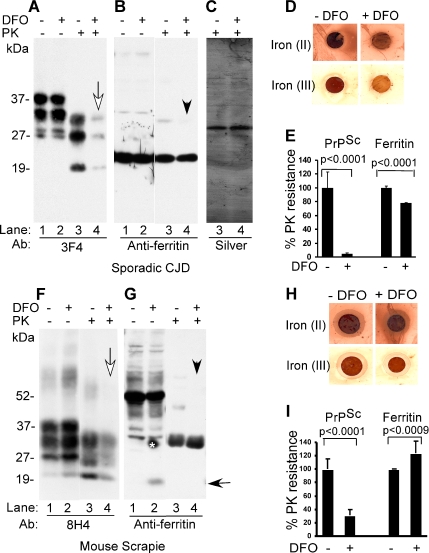
Figure 6.
(A) Control and DFO-treated sCJD homogenate and the same samples treated with PK were fractionated on SDS-PAGE and analyzed by Western blotting. Immunoblotting with 3F4 reveals normal PrP glycoforms in control and DFO-treated samples (lanes 1 and 2). Treatment with PK causes the expected shift in migration of PK-resistant PrPSc in the control sample (lane 3), whereas DFO-treated sample shows almost complete degradation of PrPSc (lane 4, white arrow). (B) Reprobing with anti-ferritin shows similar monomeric and oligomeric forms of ferritin in control and DFO-treated samples (lanes 1 and 2). However, DFO-treated samples show slight increase in sensitivity to PK, especially of oligomeric forms (lanes 3 and 4, arrowhead). (C) Silver staining shows equal amount of protein in PK-treated control and DFO-treated samples (lanes 3 and 4). (D) Reaction for ferrous and ferric iron in sCJD samples shows significant reduction in especially the ferric form after DFO treatment. (E) Quantification from four independent evaluations shows a decrease in PK-resistant PrPSc and ferritin from 99 to 10% and from 100 to 80%, respectively, after DFO treatment. n = 4. Unpaired t test shows highly significant mean difference between PK-resistant PrP and ferritin in untreated and DFO-treated CJDH. Values for PK-resistant PrP: Δmean = 95.2; 95% CI = 78.8, 111.6; t = 12.3; df = 6; p < 0.0001. Values for PK-resistant ferritin: Δmean = 21.6; 95% CI = 419.5, 23.7; t = 22.0; df = 6; p < 0.0001. (F) Immunoblotting of mouse scrapie brain homogenate with 8H4 shows the expected glycoforms of PrPSc in control and DFO-treated samples (lanes 1 and 2). After PK treatment, a significant amount of PrPSc from DFO-treated samples undergoes degradation (lanes 3 and 4). (G) Reprobing for ferritin shows prominent oligomers of ferritin migrating between 35 and 55 kDa (lanes 1 and 2), some of which are sensitive to DFO and give rise to monomeric ferritin migrating at 20 kDa (lane 2, black arrow). Treatment with PK shows increased sensitivity of monomeric and DFO-treated oligomeric forms of ferritin (lanes 3 and 4, arrowhead) (*, artifact of blotting). (H) Reaction of mouse brain homogenate for ferrous and ferric iron shows significantly less reactivity after DFO treatment. (I) Quantification shows a decrease in PK-resistant PrPSc from 98 to 25% after DFO treatment. Ferritin does not show a significant difference before or after DFO treatment. n = 4. Unpaired t test shows highly significant mean difference between PK-resistant PrP, and less significant difference between PK-resistant ferritin in untreated and DFO-treated mouse scrapie samples. Values for PK-resistant PrP: Δmean = 69.2; 95% CI = 56.4, 82.0; t = 11.4; df = 6; p < 0.0001. Values for PK-resistant ferritin: Δmean = 24.0; 95% CI = 36.6, 11.5; t = 4.0; df = 6; p < 0.0009.

