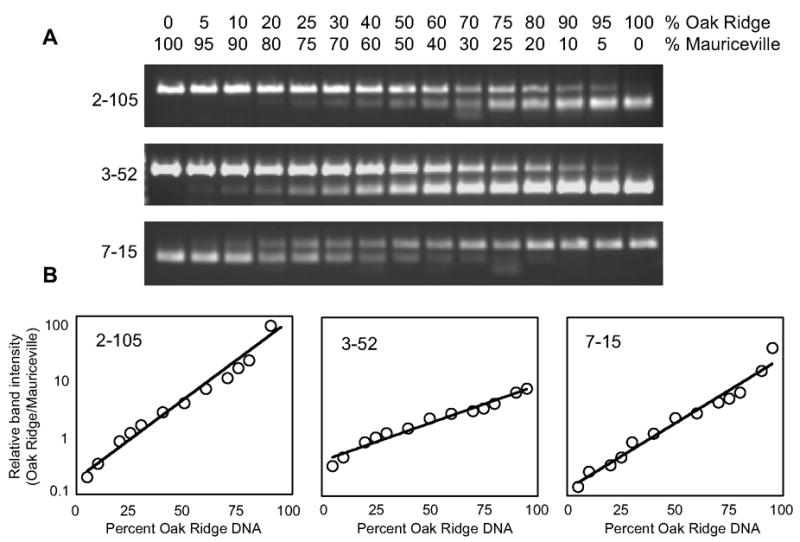
Fig. 2.

Quantitative assessment of sensitivity and detection limits for bulked segregant analysis. Mock bulks were prepared from proportions of Oak Ridge and Mauriceville-1c genomic DNA to mimic recombination and related genetic distances. (A) Representative band patterns from analysis with three CAPS markers. Note that for 2–105 and 3–52 it is the Oak Ridge “allele” that is cleaved but for 7–15 the Mauriceville allele is cleaved. (B) Band intensities for the parental alleles were determined by densitometry, and for each marker the ratio of Oak Ridge to Mauriceville allele is plotted vs. the percent Oak Ridge DNA in the bulk.
