
Figure 5.
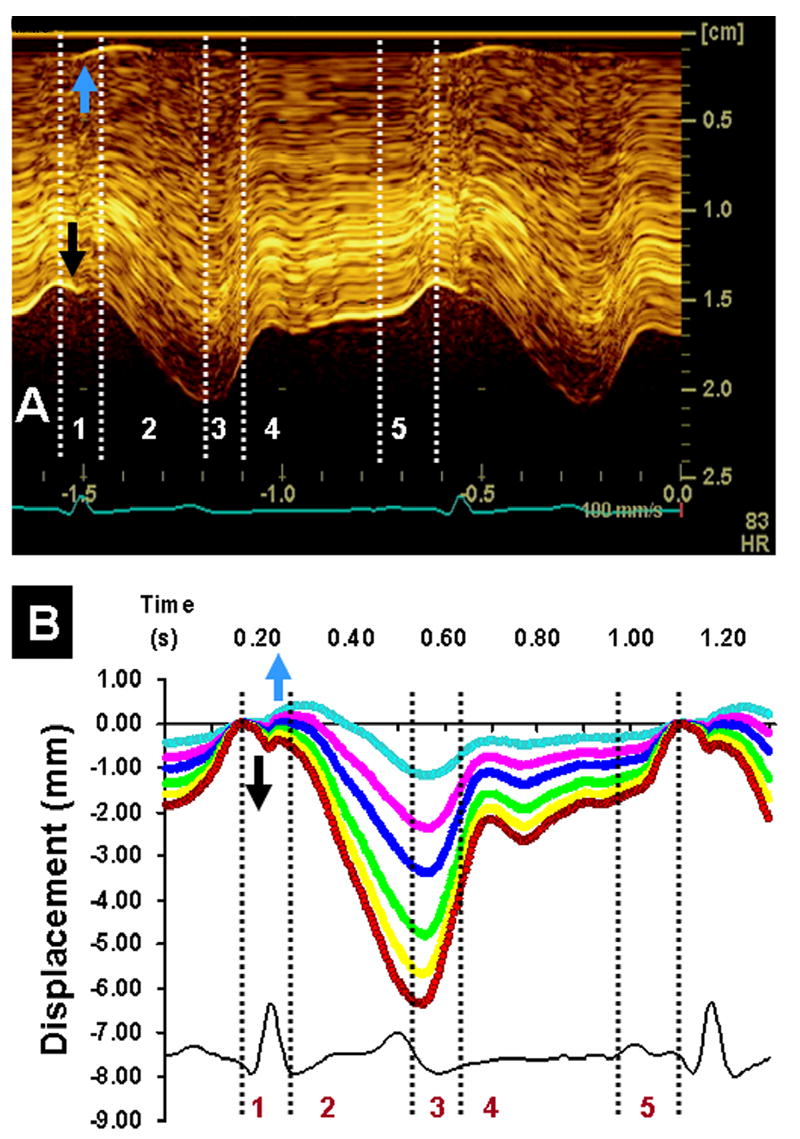
Direct in vivo imaging of anterior wall of a beating porcine left ventricle using high-resolution linear array transducer (10 mHz). Panel A shows anatomic M-mode imaging of the different layers of anterior segment of left ventricular apex at high temporal resolution (250 frames/sec). During isovolumic contraction, there is onset of motion of the endocardium towards the cavity (black arrows) and a reciprocal outward motion of the subepicardium (blue arrows). These reciprocal movements of the subendocardial and subepicardial regions are distinct on tracking movement of speckles at different depths of myocardial wall (panel B). Displacement of the subendocardial region shows an inward movement (red), whereas the subepicardial region shows an outward movement (blue) during the isovolumic period of the cardiac cycle. Phases 1–5 are described in Figure 3 legend.