
Figure 8.
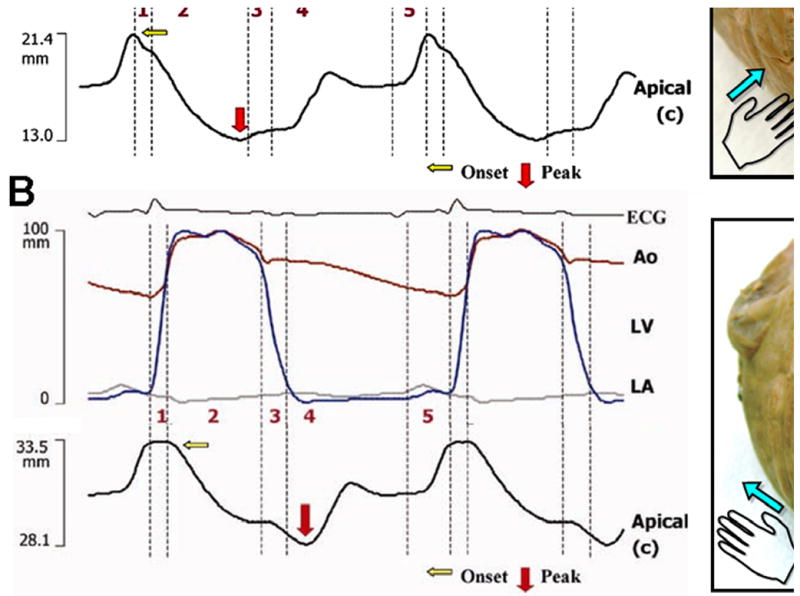
Left ventricular flow during phases of cardiac cycle. M-mode characteristics of left ventricular intracavitary flow has been obtained with anatomical M-mode obtained along the long axis of the LV cavity during contrast infusion (A). Time-related changes in intracardiac flow in 2-dimension has been obtained by using high–temporal resolution 2D imaging at 200–250 frames/s and echo contrast particle imaging velocimetry (B). High frame rates allow tracking of bubbles sufficiently to determine the 2D component of local vectors of blood motion before the bubbles move out of the scan plane. For each phase, the local ensemble-averaged axis-normal velocity magnitude is superimposed on the vector field. 1, Isovolumic contraction. 2, Ejection. 3, Isovolumic relaxation. 4, Early diastole. 5, Late diastole. LA, left atrium; LV, left ventricle