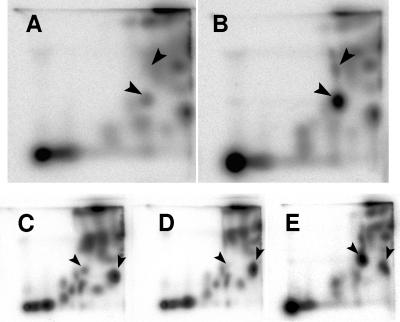
FIG. 3.
Identification of the acetyl-P signal following separation of small molecules by 2D-TLC. (A and B) Extracts of (A) WT cells (strain AJW678) and (B) WT cells spiked with synthetic [32P]acetyl-P. The arrowheads indicate orthophosphate (upper arrowhead) and acetyl-P (lower arrowhead). (C to E) Extracts of (C) WT (strain AJW678), (D) ackA pta mutant (strain AJW2013), and (E) ackA mutant (strain AJW1939). The arrowheads indicate acetyl-P (left arrowhead) and acetyl-CoA (right arrowhead).

