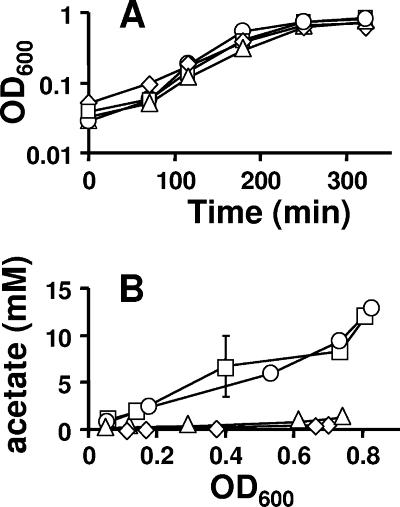
FIG. 5.
Comparison of growth (A) and extracellular acetate concentration (B) of cells aerated at 37°C in mMOPS supplemented with 0.8% pyruvate. □, WT (strain AJW678); ○, acs mutant (strain AJW1781); ▵, ackA mutant (strain AJW1939); ⋄, ackA pta mutant (strain AJW2013). The plotted values are the means of two independent experiments ± standard deviation. OD600, optical density at 600 nm.

