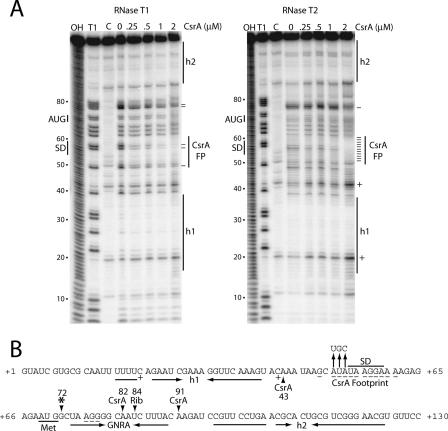
FIG. 3.
CsrA-hfq RNA footprint analysis. (A) hfq RNA was treated with RNase T1 or RNase T2 in the absence or presence of CsrA. The concentration of CsrA used is indicated at the top of each lane. Partial alkaline hydrolysis (OH) and RNase T1 digestion (T1) ladders, as well as control (C) lanes in the absence of RNase treatment, are shown. The RNase T1 ladder was generated under denaturing conditions so that every G residue in the transcript could be visualized. Residues in which RNase cleavage was reduced (−) or enhanced (+) in the presence of CsrA are marked. The positions of the CsrA footprint (FP), the hfq SD sequence, and the translation initiation codon (AUG) are shown. Two RNA segments corresponding to RNA secondary structures (h1 and h2) that were previously identified are shown (41). Numbering at the left of each gel is from the start of hfq transcription. (B) Summary of the hfq footprint results (from panel A) and toeprint results (from Fig. 4, below). The composite CsrA footprint shows the residues in which cleavage was reduced (−) or enhanced (+) by the presence of bound CsrA. Residues corresponding to the CsrA-dependent and 30S ribosomal subunit (Rib) toeprints are marked with arrowheads. An additional 30S ribosomal subunit-dependent toeprint is marked (*). The positions of the hfq SD sequence and translation initiation codon (Met) are indicated. Inverted horizontal arrows identify the residues corresponding to h1, h2, and a short RNA hairpin containing a GNRA tetraloop. Vertical arrows identify a triple nucleotide substitution introduced into the CsrA binding site. Numbering is from the start of hfq transcription.

