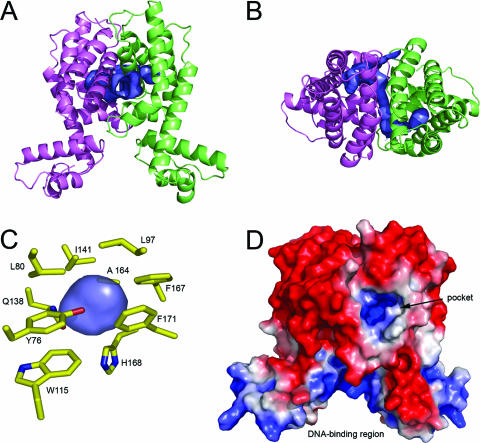
FIG. 3.
View of the solvent accessible tunnel and putative ligand-binding pocket of HapR. (A) Ribbon diagram of the HapR dimer, oriented as in Fig. 1B, showing the location of the tunnel and cavity in blue, monomer A in magenta, and monomer B in green. The surfaces in this figure were generated by using the program SURFNET (28) and rendered by using PYMOL (6). (B) Top view of the tunnel and cavities looking down the HapR dimer interface. (C) View of residues containing atoms surrounding the solvent isolated pocket in monomer B. (D) Electrostatic surface potential of the HapR dimer, oriented as in panel A. Blue and red indicate positive and negative charges, respectively. The black arrow points to the electropositive entrance to the solvent accessible tunnel and pocket, visible slightly to the right of the center of the dimer. The electrostatic surface was calculated by using the APBS (2) plug-in to PYMOL (6). Atomic charges and radii were calculated by using the AMBER force field option at the online PDB2PQR service (8).

