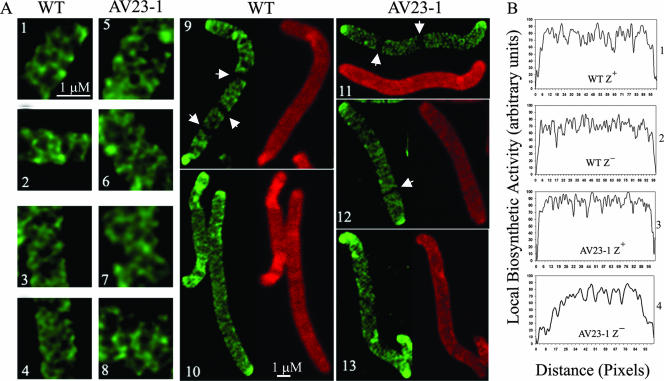
FIG. 4.
Peptidoglycan synthesis in E. coli detected by d-cysteine labeling. (A) Cells were filamented by adding aztreonam at either 2 μg/ml (for wild-type [WT] MG1655) or 1 μg/ml (for the AV23-1) (panels 1, 2, 5, 6, 9, 11, and 12). Alternatively, cells were filamented by inhibiting FtsZ by adding 0.2% arabinose to induce the expression of the SulA protein from plasmid pFAD38 (panels 3, 4, 7, 8, 10, and 13). Panels 1 to 4, 9, and 10, MG1655; panels 5 to 8 and 11 to 13, AV23-1 (ΔPBPs 5 and 7). Fluorescent fibers represent older (labeled) peptidoglycan, and dark areas represent sites of newly incorporated peptidoglycan during the chase period. Arrowheads in panels 9, 11, and 12 indicate the locations of dark transverse bands that represent new peptidoglycan incorporation at incipient sites of septation. (B) Differences in peptidoglycan insertion quantified by gray-level profiles of d-cysteine-labeled sacculi. Panel 1, MG1655 filamented with aztreonam (FtsZ+); panel 2, MG1655 filamented with SulA (FtsZ−); panel 3, AV23-1 filamented with aztreonam (FtsZ+); panel 4, AV23-1 filamented with SulA (FtsZ−).

