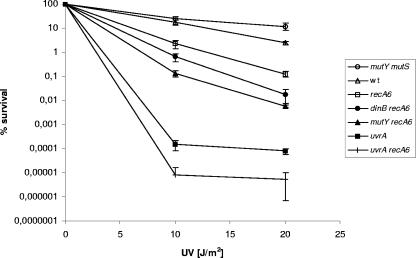
FIG. 3.
Survival of the MC DNA repair-deficient strains after exposure to different doses of UV light. The results are given as the averages of three experiments, with error bars showing the standard deviations. The 19 MC strains tested split statistically into seven groups, represented in the figure by one strain each. Group 1 is represented by mutY mutS; mutY fpg, mutS dinB, and mutY dinB mutants showed similar phenotypes. Group 2 is represented by the wild type (wt); fpg, mutY, mutS, and dinB mutants showed similar phenotypes. Group 3 is represented by recA6, and group 4 is represented by dinB recA6. Group 5 is represented by mutY recA6; the mutS recA6 mutant showed a similar phenotype. Group 6 is represented by uvrA; mutS uvrA, fpg uvrA, dinB uvrA, and mutY uvrA mutants showed similar phenotypes. Group 7 is represented by uvrA recA6.

