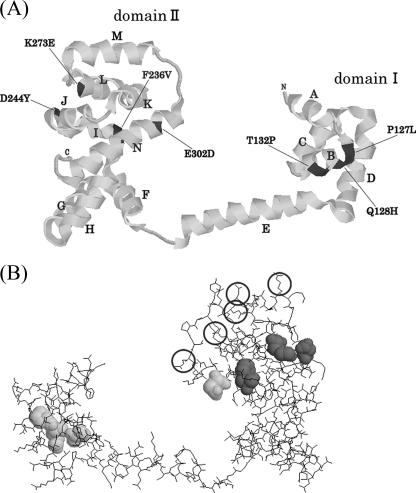
FIG. 4.
Molecular models of FliG. (A) Ribbon diagram of FliG domain structures. Distinguishable strands are indicated by the strand names, and TS mutation sites are indicated by bars and the dark ribbon. (B) Back view of FliG (molecular wireframe model). Hyper-TS mutation sites are indicated by dark balls, ordinary TS sites are indicated by lighter balls, and the functional sites previously suggested are indicated by circles.

