FIG. 1.
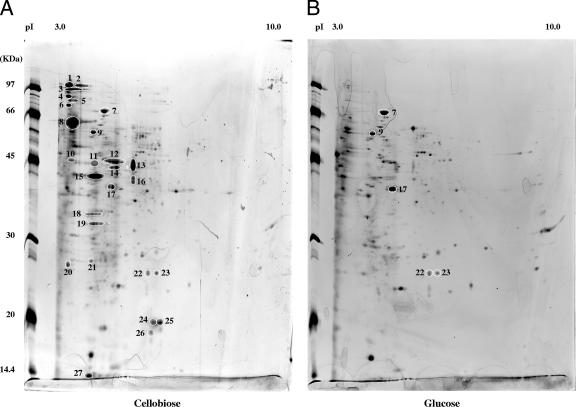
Two-dimensional maps of the extracellular proteomes of T. fusca grown on cellobiose (A) and glucose (B). Proteins were separated in a pH gradient from 3 to 10 and in the SDS-10% polyacrylamide gel electrophoresis that were visualized by silver stain. Theoretical Mr and pI scales are indicated. Spot numbering refers to those given in Table 1, which reports protein identification by LC-MS/MS.

