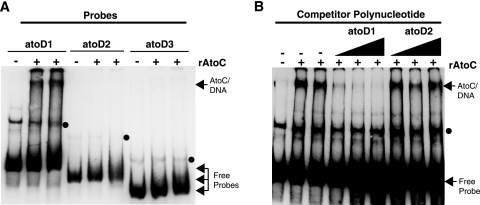
FIG. 2.
Mapping of the AtoC binding site(s) within the atoDAEB promoter. (A) The binding of AtoC (35 nM) to atoDAEB promoter regions atoD1 (−206 to +73), atoD2 (−120 to +73), and atoD3 (−47 to +73) was analyzed by nonradioactive EMSAs. (B) The DNA binding reactions were performed in the presence of 10 ng of the atoD1 probe (approximately 3 nM) and increasing amounts (5-, 10-, and 20-fold molar excesses) of either unlabeled specific (atoD1) or nonspecific (atoD2) competitors (see Materials and Methods) and analyzed by EMSAs. The AtoC-DNA complexes and the free probes are indicated by arrows, whereas the protein-independent bands are indicated by dots. +, present; −, absent.

