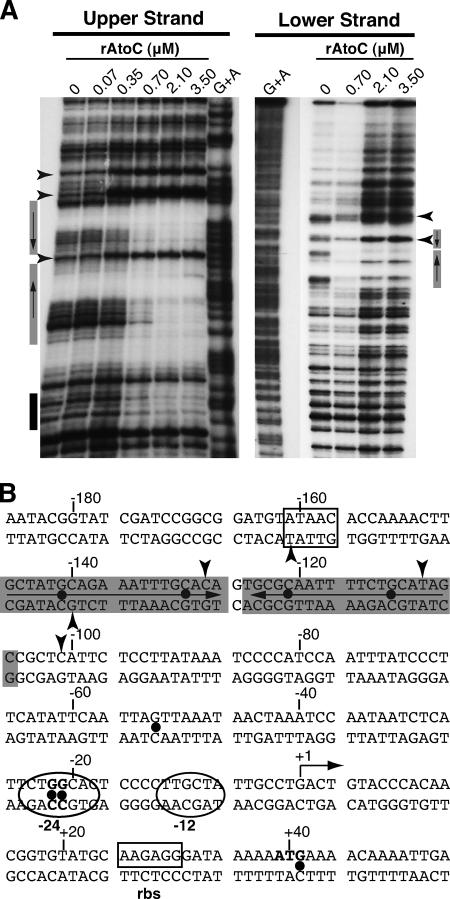
FIG. 3.
DNase I footprinting analysis of the AtoC binding sites within the atoDAEB promoter regulatory region. (A) DNase I footprinting was performed with increasing concentrations of rAtoC and promoter fragments labeled in the coding (upper) or noncoding (lower) strand. Boxes indicate the protected areas, and arrowheads indicate the hypersensitivity positions. The gray boxes indicate the inverted palindrome protected by AtoC (see the text). (B) The atoDAEB sequence (−186 to +54) and its regulatory elements are shown. Note that the transcription initiation site shown in this figure is predicted and has not been validated experimentally. Shaded sequences represent the AtoC-protected areas, and arrowheads indicate AtoC-induced hypersensitivity. The positions of some predicted functional elements, such as the promoter region from −24 to −12 (in ovals), the putative ribosome binding site (boxed), and the initiator ATG (bold), are indicated. The positions of the hydroxylamine-induced mutations that render the promoter inactive and/or unresponsive to acetoacetate (Fig. 5 and 6) are marked by dots.

