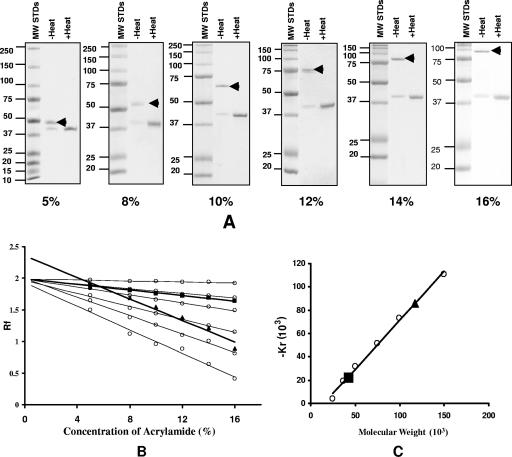
FIG. 5.
Determination of the MW of the monomer and trimer of the C. trachomatis MoPn MOMP. (A) Coomassie blue staining of an SDS-PAGE gel of the MOMP resolved at different concentrations of acrylamide. Each gel has MW standards (MW STDs) (in thousands) in the first lane. The MOMP was boiled or not boiled before loading as indicated (1 μg/lane). The arrowhead marks the band corresponding to the trimer. (B) Ferguson plot of the undenatured (i.e., unboiled) MOMP trimer (triangle) and monomer (square). The logarithms of the relative mobilities of the marker protein bands from A were graphed against the acrylamide concentrations. Molecular mass standards, from top to bottom, are as follows: 25, 37, 50, 75, 100, and 150 kDa. The mobility of proteins relative to that of dye front (Rf) was plotted against the total acrylamide concentration on a log scale. (C) Plot of retardation coefficient (Kr) versus MW. The values for the retardation coefficient (Kr) were calculated by linear regression analysis of the lines in B and multiplications times 103. The triangle corresponds to the MOMP trimer, and the square corresponds to the monomer.

