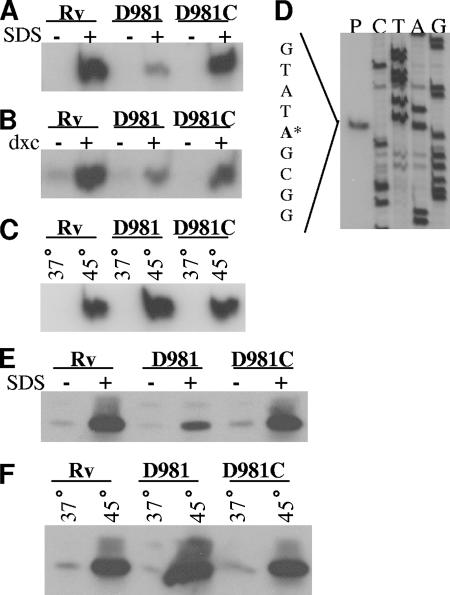
FIG. 2.
Analyses of the acr2 TSP and Acr2 synthesis under stress. (A to D) RNA was extracted from M. tuberculosis cultures, and the 5′ ends of the acr2 transcripts were mapped by primer extension using primer Rv0251cPE-2. Strains were incubated under control conditions or were exposed to 0.05% SDS (A), 0.1% deoxycholate (B), or 45°C (C). Because of the greater band intensity with SDS and heat shock exposures, smaller amounts of RNA were loaded for panels A and C than for panel B. Control bands were visible in panels A and C upon longer exposures. (D) Mapping of the acr2 TSP. The primer extension reaction (lane P) was performed with H37Rv RNA and was electrophoresed alongside a sequence ladder generated by the same primer. The TSP is the adenosine indicated by the asterisk in the sequence to the left of the panel. (E and F) Western blot analyses of Acr2. Cell extracts were prepared from cultures incubated under control conditions or exposed to 0.05% SDS (E) or 45°C (F). Samples of 10 μg protein were loaded. Electrophoresis was performed under reducing conditions. Western blots were prepared and probed with an anti-Acr2 antibody, followed by probing with goat anti-rabbit antibody conjugated with horseradish peroxidase. Rv, H37Rv; D981, Rv-D981; D981C, Rv-D981C. Control samples are indicated by a minus sign or 37°C. Stress samples are indicated by a plus sign or 45°C.

