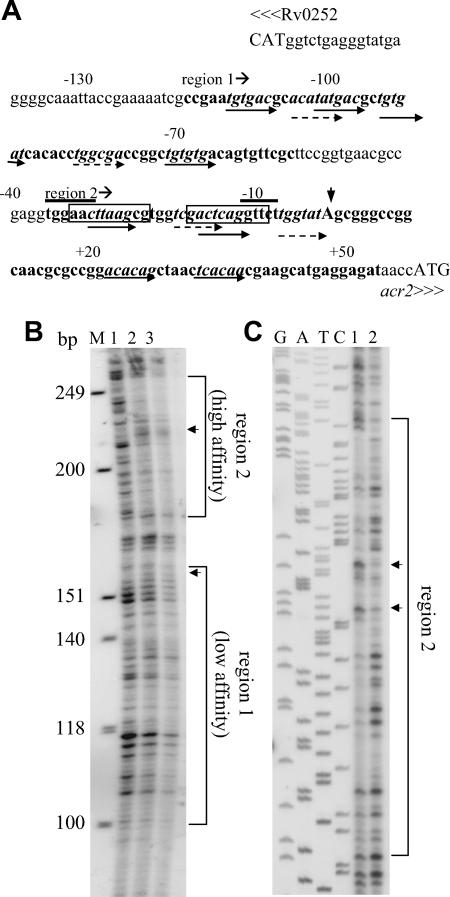
FIG. 4.
Association of MprA with the acr2 promoter region. (A) Features of the region upstream of acr2 (Rv0251c). Potential MprA binding sites are indicated by italicized sequences and paired arrows. Dashed and solid arrows indicate motif subunits that either share two or share three or more bases, respectively, with the MprA binding consensus TCTCAG. Numbers indicate the positions relative to the acr2 TSP. The overlined sequences are the overlapping −35 and −10 promoter consensus sequences for SigH and SigE (22, 23, 33). The boxed sequences are the predicted HspR binding sites (44). Capital letters indicate start codons. The vertical arrowhead indicates the acr2 TSP. Sequences in boldface are regions protected by MprA in DNA footprinting assays. The start of each region is indicated. (B and C) DNA footprinting analyses of the acr2 promoter region. Protected regions are bracketed. Arrowheads mark areas of DNase I hypersensitivity in the presence of MprA. (B) Analysis of the sense strand showing protected regions 1 and 2. Lane 1, no MprA and 1 U DNase I; lane 2, 2 μg MprA and 1 U of DNase I; lane 3, 8 μg MprA and 1 U of DNase I. M, molecular size markers (HinfI-digested φX174). The positions of the protected regions were verified using a sequence ladder included on the same gel (not shown). (C) Analysis of the antisense strand. Samples were run beside a DNA sequence ladder generated with M13mp18. Both regions were analyzed, but only the high-affinity region (region 2) is shown. Lane 1, 4 μg MprA and 1 U of DNase I; lane 2, no MprA and 1 U of DNase I. Note that the sample loadings in panels B and C are in reverse order.

