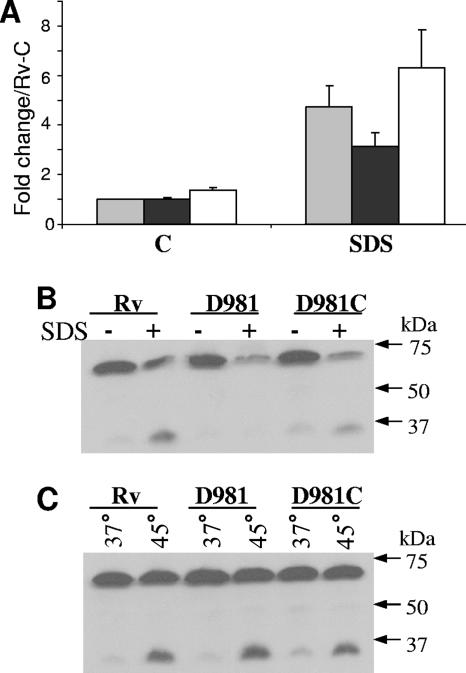
FIG. 5.
Expression pattern of sigA under stress. (A) RNA extracts were prepared and analyzed by real-time PCR, as described in the legend to Fig. 1, using a probe and primers that hybridized within the 5′ end of sigA. Data are the means ± standard errors of the means from three separate experiments. H37Rv, gray bar; Rv-D981, black bar; Rv-D981C, white bar; C, control cultures; SDS, SDS-treated cultures; Rv-C, H37Rv control. (B and C) Western blot analyses of SigA using extracts of samples exposed to 0.05% SDS (B) or 45°C (C). The blots used in experiments depicted in Fig. 2 were stripped and reprobed with an anti-SigA antibody. SigA migrates at ∼70 kDa under the conditions used and is visible as the strong upper band. The lower band is probably SigB, which is ∼36 kDa (2).

