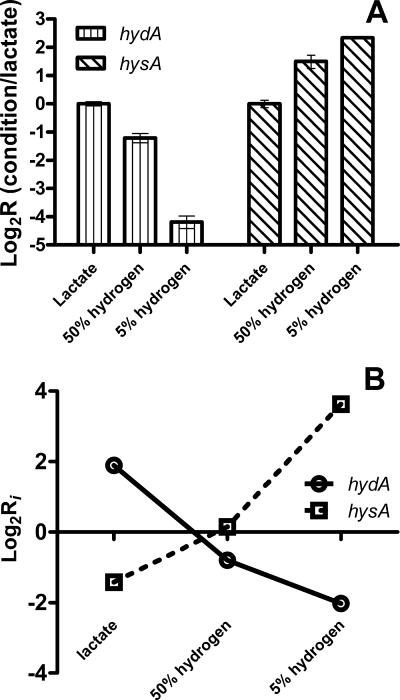
FIG. 3.
Changes in expression levels of hydA and hysA genes. (A) RT-PCR data for each condition (lactate, 50% H2, or 5% H2) were normalized for expression of 16S rRNA and are presented relative to expression with lactate. (B) Microarray hybridization intensity ratios, Ri = <cDNAi>/<gDNAi>, were calculated from measured data as described in the text. The log2Ri values for the hysA and hydA genes are plotted for growth with lactate, 50% (vol/vol) hydrogen, or 5% (vol/vol) hydrogen.

