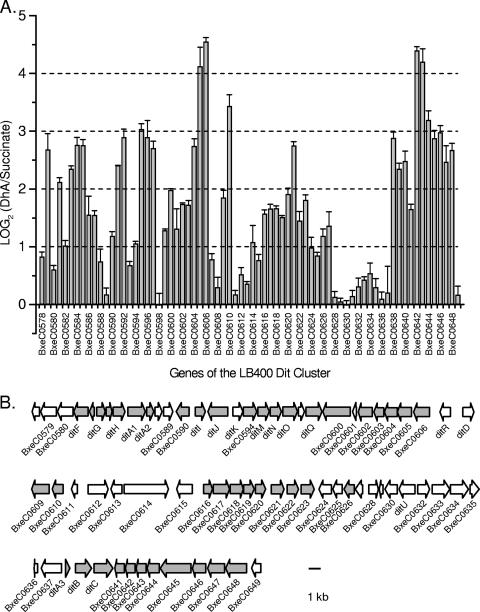
FIG. 1.
(A) Relative signal intensities for genes of the LB400 dit cluster during growth on DhA versus on succinate. Error bars indicate the standard error. (B) Physical map of the LB400 dit cluster. The three rows of arrows represent one contiguous cluster of genes, showing gene size and orientation. Shaded arrows represent genes significantly upregulated on DhA.

