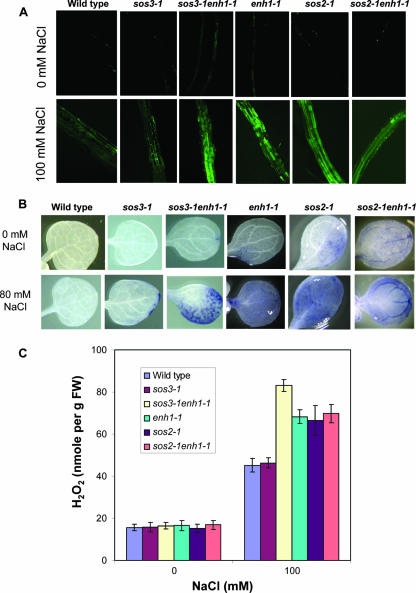
FIG. 6.
Detection of ROS. (A) ROS levels in roots in different mutants after CM-H2DCFDA staining. (B) Nitroblue tetrazolium staining for superoxide in unstressed or salt-treated (80 mM NaCl) seedlings. (C) H2O2 production under salt treatment. Error bars represent standard deviations (n = 6). FW, fresh weight.

