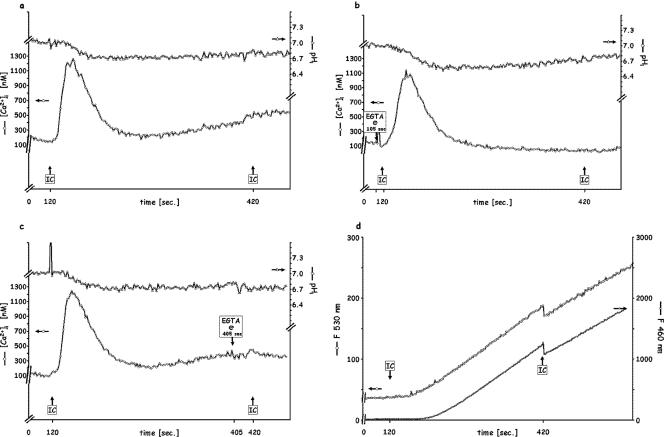
FIG. 5.
Sequential stimulation of PMN by saturating doses (120 μg/ml) of IC 5 min apart. (a) Control, (b) 5 mM EGTA added 15 s before the first IC injection; (c) 5 mM EGTA added before the second IC injection; (d) release of elastase (shown as F460) and of oxidative products (shown as F530). In panel d, the sharp decrease upon injection is due to light scatter (see Results). Each figure is representative of six independent experiments.

