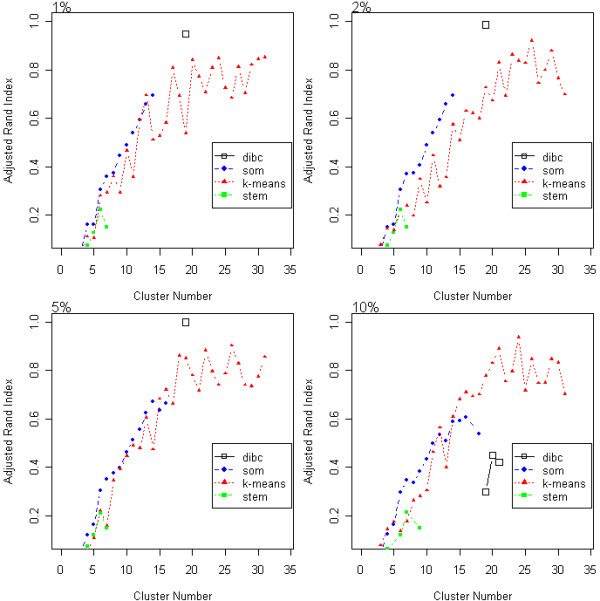
Figure 2.

ARI of the simulated data. The adjusted rand index (ARI) of the simulated data is plotted according to cluster number. Higher ARI, values indicate more accurate clustering results. Three algorithms were compared under four different noise (1, 2, 5, and 10%.)
