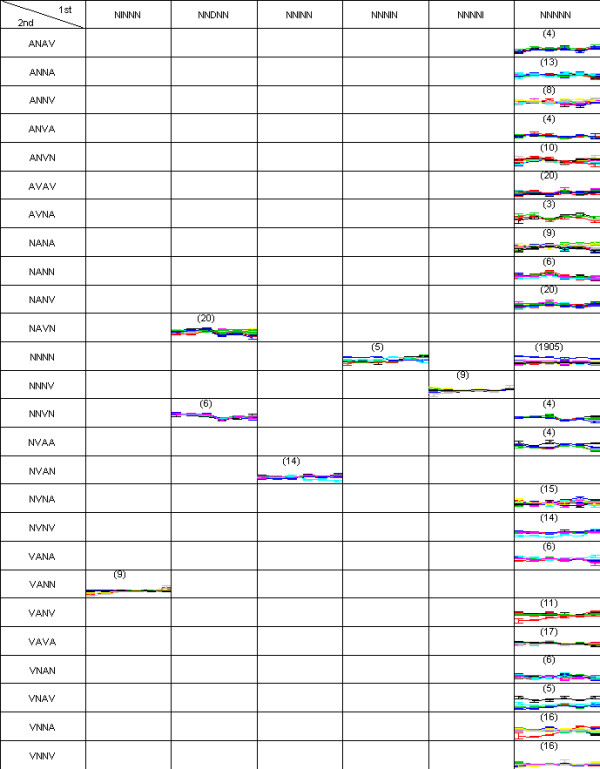
Figure 9.

hierarchical layer of pancreas data. Hierarchal structure of clustering results are drawn as a from the pancreas data. Three layers (or clustering results) are attached to the root produced from the corresponding cutoff pairs of (1 × 10⁻⁵, 2 × 10⁻⁵), (6 × 10⁻⁴, 1 × 10⁻⁵), and (9 × 10⁻⁴, 3 × 10⁻³). An interactive figure in SVG format is available on the supplement page [27].
