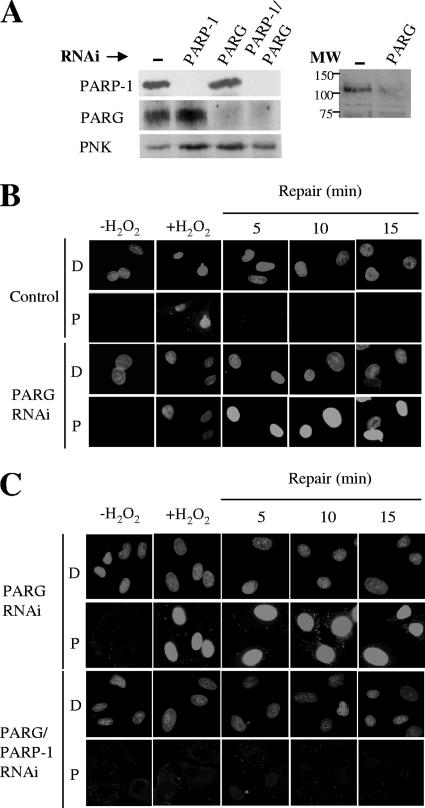
FIG. 4.
Impact of PARP-1 and/or PARG depletion on levels of H2O2-induced PAR synthesis. (A) The left panel shows levels of PARP-1 and PARG proteins in total cell extracts from A549 cells transfected with pcD2E and either empty pSuper (Control), pSuper-PARP-1 (PARP-1), pSuper-PARG (PARG), or both pSuper-PARP-1 and pSuper-PARG (PARP-1/PARG), as measured by immunoblotting with anti-PARP-1 MAb, anti-PARG polyclonal antibody, and anti-PNK polyclonal antibody as a loading control. The right panel shows the immunoblot of a different set of cell extracts from normal (−) and PARG-depleted A549 cells with anti-PARG antibody, showing the specificity of the antibody in the region of the blot containing full-length (110-kDa) PARG. The positions of molecular weight (MW) standards are shown. (B) Levels of PAR (rows P) in normal (Control) or PARG-1-depleted (PARG RNAi) A549 cells before treatment with 10 mM H2O2 on ice (−H2O2), 1 min after H2O2 treatment (+H2O2), and after the indicated repair periods in drug-free medium, as measured by indirect immunofluorescence microscopy. Cells were counterstained with DAPI (rows D) to identify nuclear DNA. (C) Levels of PAR (rows P) in PARG-1-depleted (PARG RNAi) or PARG-1/PARP-1-depleted (PARG/PARP-1 RNAi) A549 cells treated as described in the legend to panel B. Cells were counterstained with DAPI (rows D) to identify nuclear DNA.

