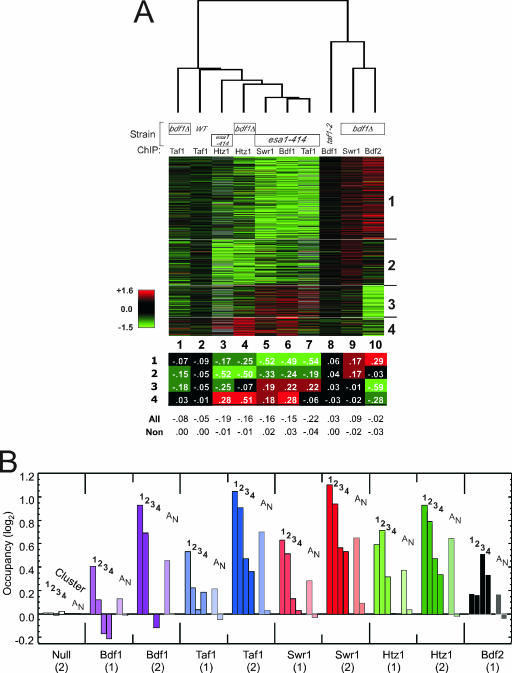
FIG. 2.
Cluster plot of genome-wide changes in factor occupancy in mutant versus wild-type strains. (A) Changes in factor occupancy in the indicated mutants. ChIP-chip was performed on the indicated factors in the indicated strains. Assays were run in parallel with mutant and wild-type (WT) strains, which were labeled separately with Cy3 and Cy5 fluorescent dyes and cohybridized to spotted microarrays containing ∼6,000 intergenic-region-length PCR-generated probes. Data are presented as a cluster diagram (14) in which each row is an intergenic promoter region and each column is an average of two dye-swapped replicates. Red, green, and black denote increases, decreases, and no change in binding, respectively. Data were filtered to include only those intergenic regions that contained a single promoter region and had the largest change in occupancy (i.e., <10th or >90th percentile in at least one column). Six hundred eleven intergenic regions (∼10% of the analyzed genome) met these criteria. These intergenic regions are intended to be the strongest representatives of the genome so as to generate the strongest patterns. Such patterns are nevertheless likely to be applicable, with lower intensity, to most other intergenic promoter regions. Rows were grouped according to k means into four clusters (with 283, 158, 108, and 62 intergenic regions) (14). Columns were clustered hierarchically (14). The table below the cluster plot provides the average log2 ratio in each cluster for each experiment. “All” denotes all promoters, and “Non” denotes nonpromoter intergenic regions (i.e., regions between two convergently transcribed genes). (B) Average occupancy of the indicated factors for the promoter regions of clusters 1 to 4. “A” denotes all single-promoter intergenic regions (>3,000), and “N” denotes nonpromoter intergenic regions (>1,000). Data for sets designated “(1)” are the log2 ratios of the wild-type reference data set presented in panel A (binding after a shift to 37°C for 45 min) divided by the ChIP result for a “Null” untagged control (58). Data for sets designated “(2)” are the log2 ratios of the wild-type data set from reference 58 (binding after a shift to 37°C for 15 min) divided by a “Null” result. The two data sets were collected from two different studies which differed only in the time at 37°C (15 versus 45 min) before binding was measured. Their trends were similar, thereby providing additional confidence in the conclusions drawn from the data. Log2 values are relative to those for nonpromoter regions.

