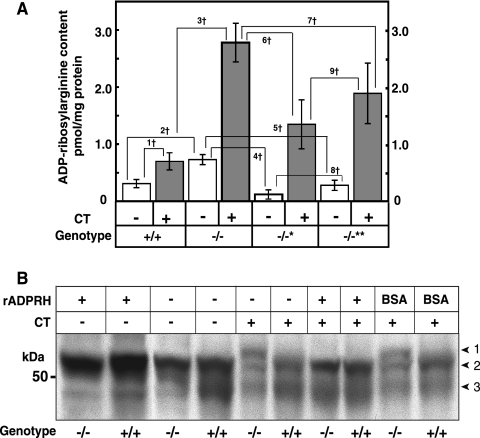
FIG. 3.
Effects of CT on ADP-ribosylated Gsα and other proteins in cultured cells of ADPRH+/+ and ADPRH−/− mice. (A) ADP-ribosylarginine content of cultured cells with indicated ADPRH alleles that had been incubated for 6 h without (open bar) or with (shaded bar) 1.0 μg of CT in 10 ml of DMEM. Data are means ± SEM of values from three experiments with triplicate assays. 1†, P = 0.0001; 2†, P = 0.0001; 3†, P = 0.0006; 4†, P = 0.000003; 5†, P = 0.00004; 6†, P = 0.0004; 7†, P = 0.018; 8†, P = 0.016; 9†, NS, not significant. (B) Effect of recombinant mouse ADPRH on Gsα from cultured cells incubated with CT. The cells were treated with CT (0.1 μg/ml) for 2 h in 5 ml of DMEM medium containing 10% fetal calf serum before homogenization. Samples (30 μg of protein) of homogenates from TCA-treated cells were incubated at 30°C for 1 h without or with 0.5 μg of ADPRH or bovine serum albumin followed by the addition of 5 μl of 4× SDS sample buffer, separation of protein by SDS-PAGE, and immunoblotting with antibodies against Gsα. Numbered arrowheads are as follows: 1, ADP-ribosylated Gsα; 2, 52-kDa Gsα; and 3, 45-kDa Gsα band.

