FIG. 8.
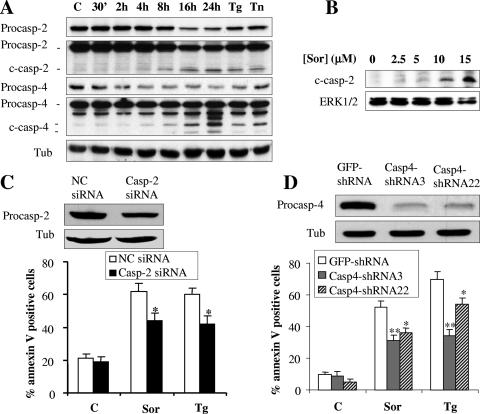
Treatment with sorafenib results in caspase-2 and caspase-4 processing. (A) U937 cells were exposed to 10 μM sorafenib (Sor) for the designated intervals or to 0.5 μM thapsigargin (Tg) or 0.5 μg/ml tunicamycin (Tn) for 16 h, after which protein lysates were prepared and subjected to Western blot analysis to monitor the protein levels of procaspase-2 (procasp-2) and procaspase-4 (procasp-2) and their cleavage products (c-casp-2 and c-casp-4, respectively). Note that high as well as low exposures of the blots were utilized to facilitate visualization of the decline in expression of the procaspases and the appearance of their cleavage fragments. (B) Leukemia blasts were isolated from the peripheral blood of a patient with AML (FAB classification M2) and exposed to the designated concentration of sorafenib (Sor) for 6 h, after which cells were lysed and protein was subjected to Western blot analysis to monitor caspase-2 processing. The blot was reprobed with ERK1/2 antibodies to document equivalent loading and transfer. (C) Jurkat cells were transiently transfected with siRNA directed against caspase-2 or negative-control (NC) siRNA for 24 h. Cells were then exposed to 10 μM sorafenib or 1 μM thapsigargin (Tg) for an additional 24 h, after which cells were lysed and protein lysates were subjected to Western blot analysis to monitor expression of caspase-2. Alternatively, the extent of apoptosis was determined using an annexin V staining assay. Values represent the means for three separate experiments ± standard deviations. *, significantly lower than values for NC transfected cells (P < 0.02). (D) Two U937 clones (casp4-shRNA3 and casp4-shRNA22) in which caspase-4 was knocked down and their control counterparts (GFP-shRNA) were monitored for expression of procaspase-4 by using Western blot analysis (upper). Alternatively, cells were exposed to 10 μM sorafenib (Sor) or 0.5 μM thapsigargin (Tg) for 24 h, after which the extent of cell death was monitored using an annexin V staining assay (lower). Values represent the means for three separate experiments ± standard deviations. * and **, significantly lower than values for GFP-shRNA cells (P < 0.02 and P < 0.01, respectively). C, control; Tub, antitubulin antibody.

