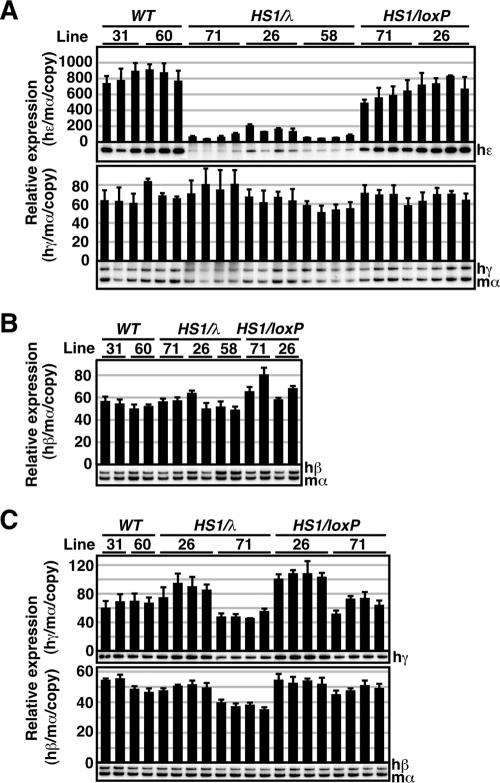
FIG. 3.
Expression of the human β-like globin genes in HS1/λ TgM. (A) Total RNA was prepared from the yolk sacs of more than two embryos (9.5 dpc) derived from the intercross of male transgenic and female WT animals. Samples were collected from two independent litters of each mutant line. Expression of human ɛ (hɛ)- and human γ (hγ)-globin compared to endogenous mouse α (mα)-globin genes was separately analyzed by semiquantitative RT-PCR. The signals for hɛ-globin at 18 cycles and hγ/mα-globin at 12 cycles were quantified by PhosphorImager, and the ratios of hɛ/mα (top) and hγ/mα (bottom) were calculated (the mα signal at 12 cycles was set at 100%, and the values are normalized by transgene copy numbers). (B) Total RNA was prepared from the spleens of 1-month-old anemic mice. Samples were collected from two individuals from each line of TgM. Expression of human β (hβ)-globin compared to endogenous mα-globin genes was analyzed by semiquantitative RT-PCR. The signal for hβ/mα-globin at 12 cycles was quantified, and the ratio of hβ/mα was calculated (the mα signal at 12 cycles was set at 100%). (C) Total RNA was prepared from the fetal livers (14.5 dpc) derived from the intercross of male transgenic and female WT animals. Samples were collected from two independent litters of each mutant line. Expression of hγ- and hβ-globin compared to endogenous mα-globin genes was analyzed separately by semiquantitative RT-PCR. The signals for hγ-globin at 18 cycles and hβ/mα-globin at 12 cycles were quantified, and the ratios of hγ/mα (top) and hβ/mα (bottom) were calculated (the mα signal at 12 cycles was set at 100%). The averages ± SD from at least three independent experiments was calculated and are graphically depicted. Representative results are shown below each panel.

