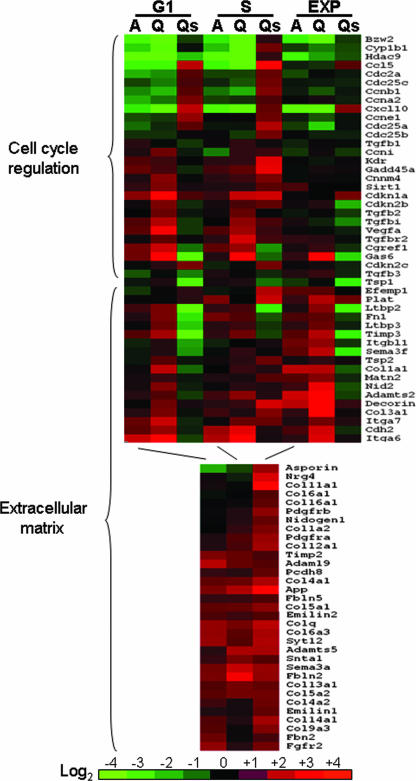
FIG. 4.
Heat map of gene expression differences between Off*Ahr−/− and Off*Ahrb cells. The color comparison represents gene expression changes in Off*Ahr−/− cells relative to those in Off*Ahrb cells; thus, red represents genes with higher expression levels in Off*Ahr−/− cells and green represents genes with lower expression levels in Off*Ahr−/− cells. The heat map was developed for gene expression values of cells in G0/G1 and S, and exponentially growing cells, as indicated at the top of the graph. “A” denotes the values from microarray hybridization, and “Q” denotes the corresponding values from quantitative real-time RT-PCR. “Qs” denotes the values from quantitative real-time PCR in Off*Ahr−/− cells infected with adeno-Smad7 for 24 h.

