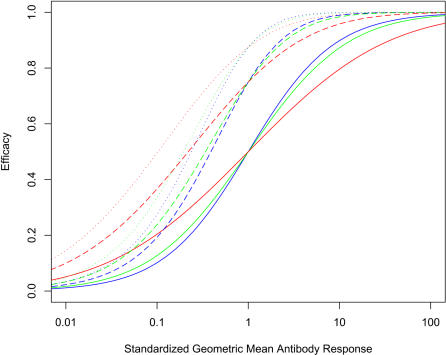
Figure 2. Model prediction for the efficacy of single component vaccines (solid line), two component vaccines (dashed lines) and three component vaccines (dotted lines) as a function of the mean immune response elicited in the population to each component.
This data set assumes that each component contributes equally to the efficacy, the immune responses to the individual immunogens are not correlated and that the log transformed distribution of the immune response is normal with a fold range of 9 (blue), 65 (green) and 5,000 (red).

