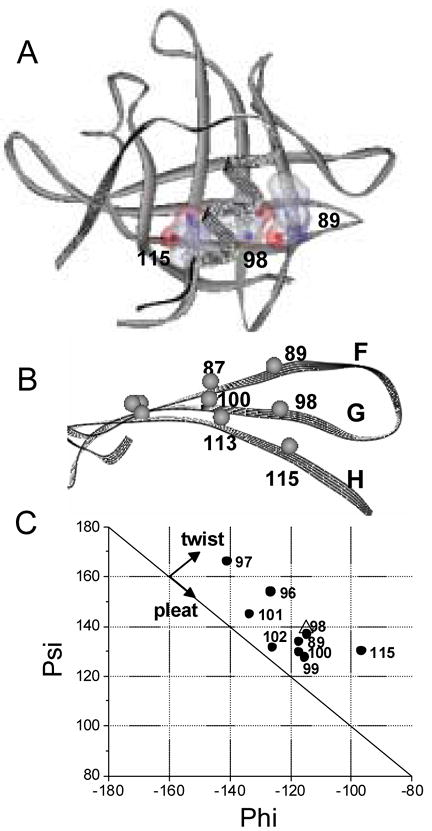
Figure 3.

Ribbon model of TL generated from PDB: 1XKI [14] using ViewerLite 5.0 (Accelrys Inc.). (A) The position of the side chain for residue I98 (G-strand) relative to that of the flanking residues I89 (F-strand) and L115 (H-strand). The side chains are shown by combination of “ball and stick” and surface representations. Gray, blue and red balls represent carbon, nitrogen and oxygen atoms, respectively. (B) Side view of G and flanking strands, F and H. Gray balls are the positions of the α-carbons of respective residues. (C) A Ramachandran plot of residues in G and its flanking F (I89), H (L115) strands (solid circles) (PDB: 1XKI). To compare the extent of the β-strand twists, residue E114 (open triangle) of CRBP (PDB: 1CRB [38]) are also added to the plot.
