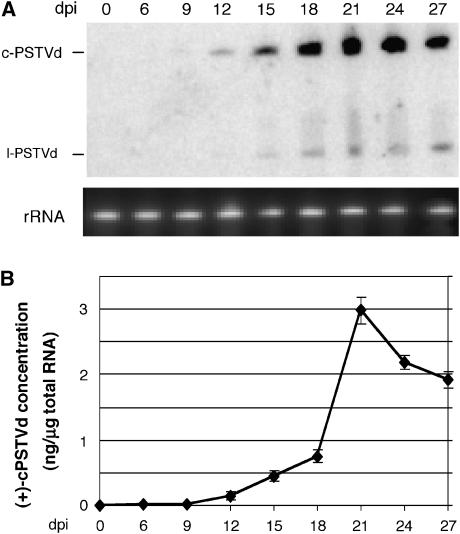
Figure 2.
Time course for PSTVd systemic infection in N. benthamiana plant. (A) RNA blots showing accumulation of both the (+)-circular (c-PSTVd) and linear (l-PSTVd) viroid RNAs at successive dpi. rRNA serves as loading control. (B) Quantification of the accumulation levels of c-PSTVd from RNA blot results, calculated by using the known amounts of loading size markers in the same gel as references. Each data point represents the mean value of three biological replicates.

