Figure 1.

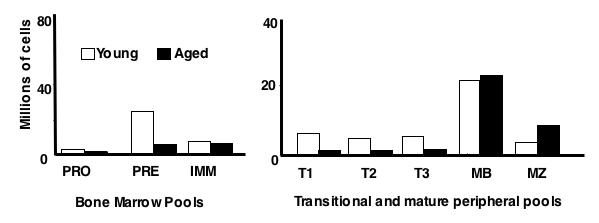
Numbers of cells in each B cell subset in young and aged mice. These numbers represent samples of >18 mice in each case with c.v.≤ 10%.

Numbers of cells in each B cell subset in young and aged mice. These numbers represent samples of >18 mice in each case with c.v.≤ 10%.