
Figure 1.
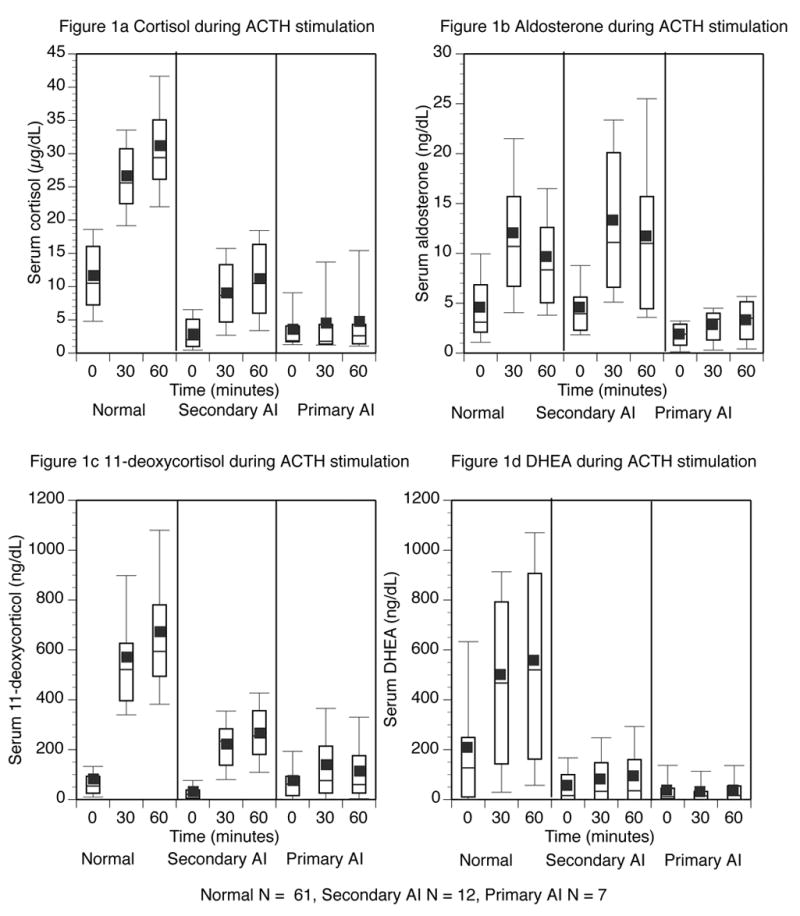
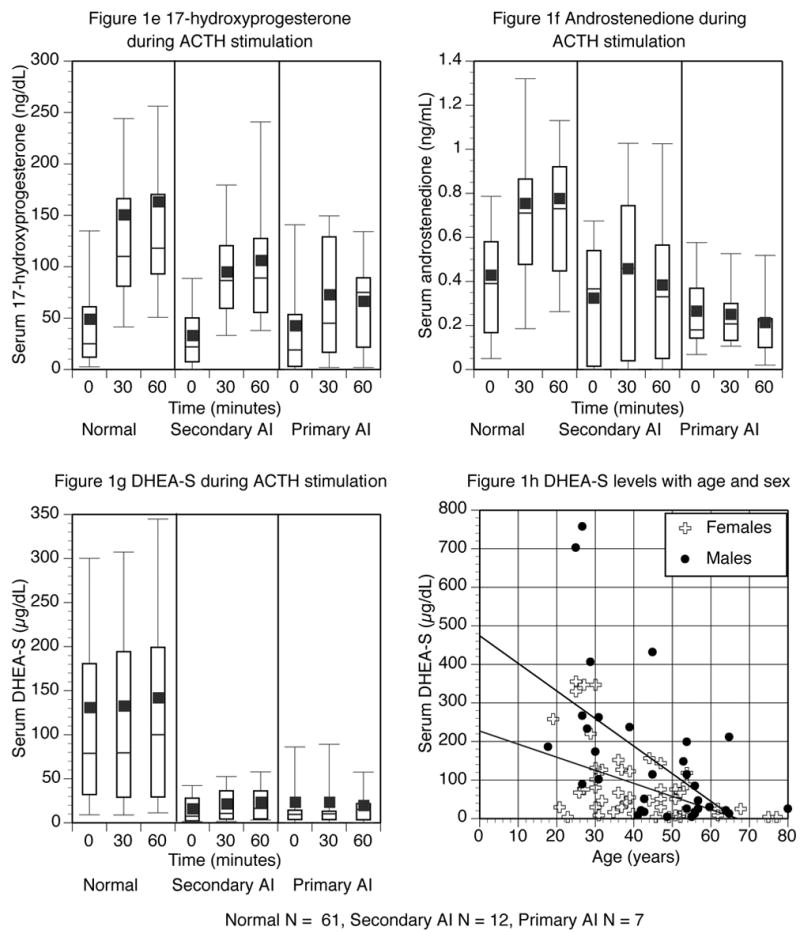
Steroid levels before, and 30 and 60 minutes after ACTH injection. Normal subjects are shown on the left panel, subjects with secondary AI in the middle panel, and those with primary AI in the right panel. The top and bottom of the box represent the 75th and 25th percentile. The line through the middle of the box and the square correspond to the 50th percentile (median) and mean respectively. The whiskers on the top and bottom of the box extend to the 90th and 10th percentile.