
Fig. 1.
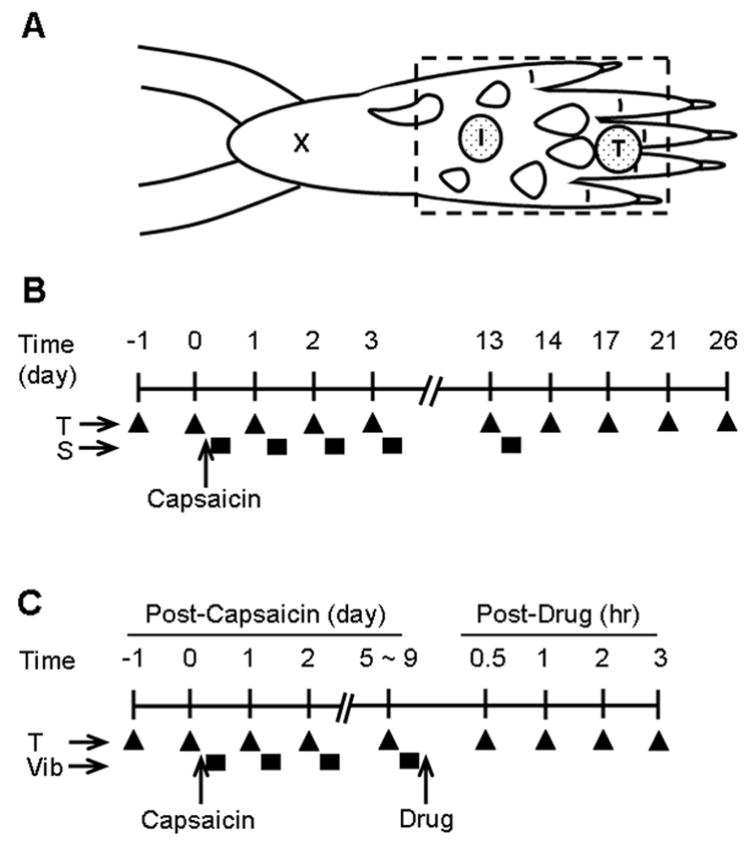
Diagrammatic representations of experimental paradigms for the capsaicin injection, behavioral test (T), innocuous mechanical stimulation (S), and drug treatment. (A) Illustration of the sites of capsaicin injection (I), behavioral testing site (T), and the region where conditioning stimuli were applied (dashed rectangle). The “x” is the initial needle insertion site for the capsaicin injection. (B) the experimental schedule for Experiment 1. “T” indicates the timing of behavioral testing (measurement of mechanical thresholds, filled triangle) in relation to the capsaicin injection (0.5%, 20 μl, i.d.) and repeated innocuous mechanical stimulation (S, filled rectangle boxes). (C) The experimental schedule for Experiment 2. “T” indicates the timing of behavioral testing, and “Vib” indicates that of vibration stimulation (filled rectangle boxes).