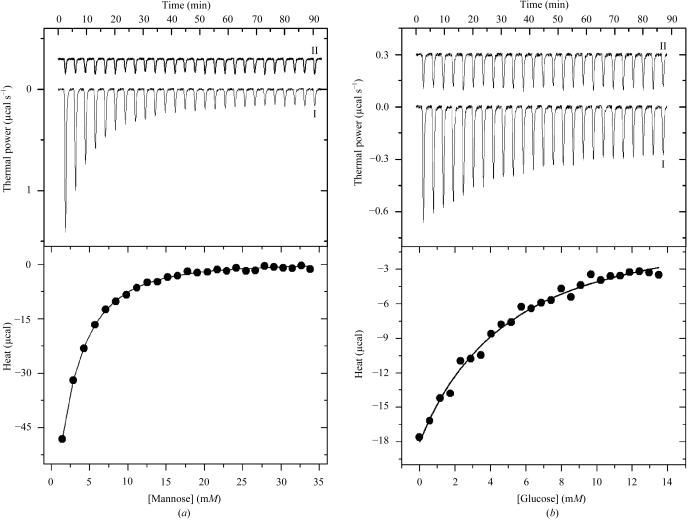
Figure 1.
Upper panels: high-sensitivity isothermal titration calorimetry of P. platycephala seed lectin with mannose (a) and glucose (b) (trace I) together with the dilution experiment (trace II). The monosaccharide solution was injected in small increments of 5 µl into the reaction cell containing the protein solution. The power output, in units of µcal s−1, is shown as a function of time for successive injections of ligand. Lower panels: calorimetric binding isotherms corresponding to the experiments presented in the upper panels. The area under each peak (amount of heat released by the binding event at a given degree of saturation) is plotted against the concentration of ligand in the cell. The continuous line represents the result of the non-linear least-squares fitting of the data to the identical binding sites model. Thermodynamic parameters are shown in Table 1 ▶.

