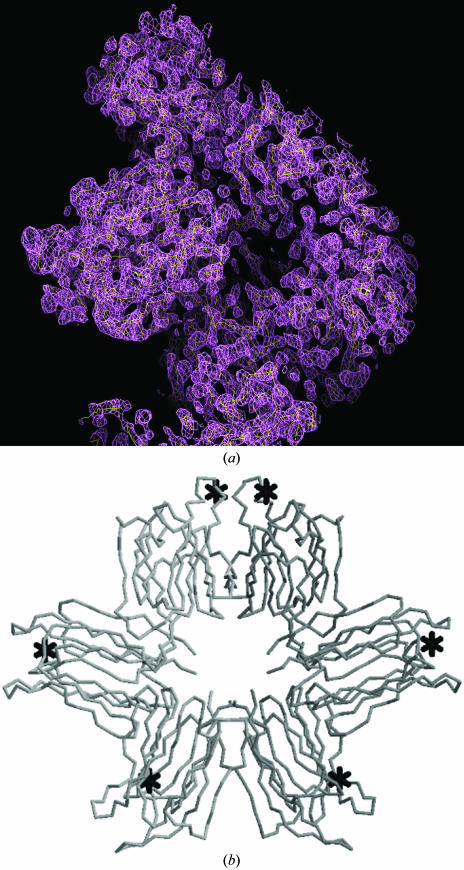
Figure 3.
(a) Electron-density map of a P. platycephala lectin dimer obtained by MAD using the Br of X-mannose as an anomalous scatterer. The map was calculated with the program FFT (CCP4 package) using the phases calculated after density modification and contouring at 1σ. The map was skeletonized using MAPMAN (base level for the electron density 1.5σ and step size for the skeletonization 0.5σ). (b) Cα-backbone tracing of the six β-prism domains building up a P. platycephala lectin dimer in the asymmetric cell unit of the monoclinic crystal. The position of the six Br atoms, presumably near the monosaccharide binding sites, are indicated by asterisks.

